This post is about setting up a distance monitoring system (in my case, for water level) using a LoRaWAN sensor and AWS services. The goal was to use as little code as possible. My father has a small alpine cabin where he faces challenges with water intrusion in the basement. His approach was to check every few days, but I wanted to automate the process. Here’s how I did it.
The Problem
There is always a slight flow of water that is typically removed by a solar-powered water pump. However, occasionally, the system fails because either the solar battery runs low or the float lever stops working, rendering the pump ineffective.
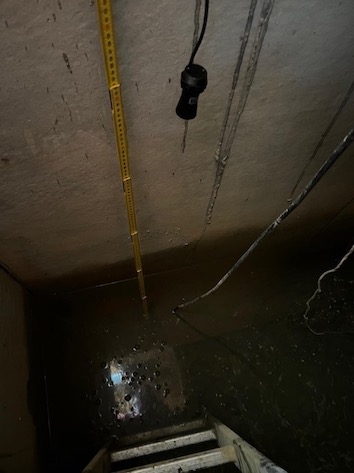
Basement with water and the sensor attached to the ceiling.
The Sensor
Since there is no internet connectivity in that location, I sought out a LoRaWAN sensor. I use the DDS75-NB distance detection sensor from Dragino, which is a module utilizing ultrasonic sensing technology for measuring distances. Additionally, it performs internal temperature compensation to enhance the reliability of the data.
Connectivity (LoRaWAN)
First, I onboarded the sensor to The Things Network, which worked well initially. However, after a nearby gateway disappeared, I lost coverage and needed an alternative. I switched to the Helium Network, which I found to be more reliable and to offer better coverage for my use case.
Onboarding the Sensor to Helium and Bridging to AWS
Here is the process for onboarding a sensor to the Helium Network and bridging its data to AWS. I assume you already have an AWS account and will not detail the initial steps of building on AWS.
-
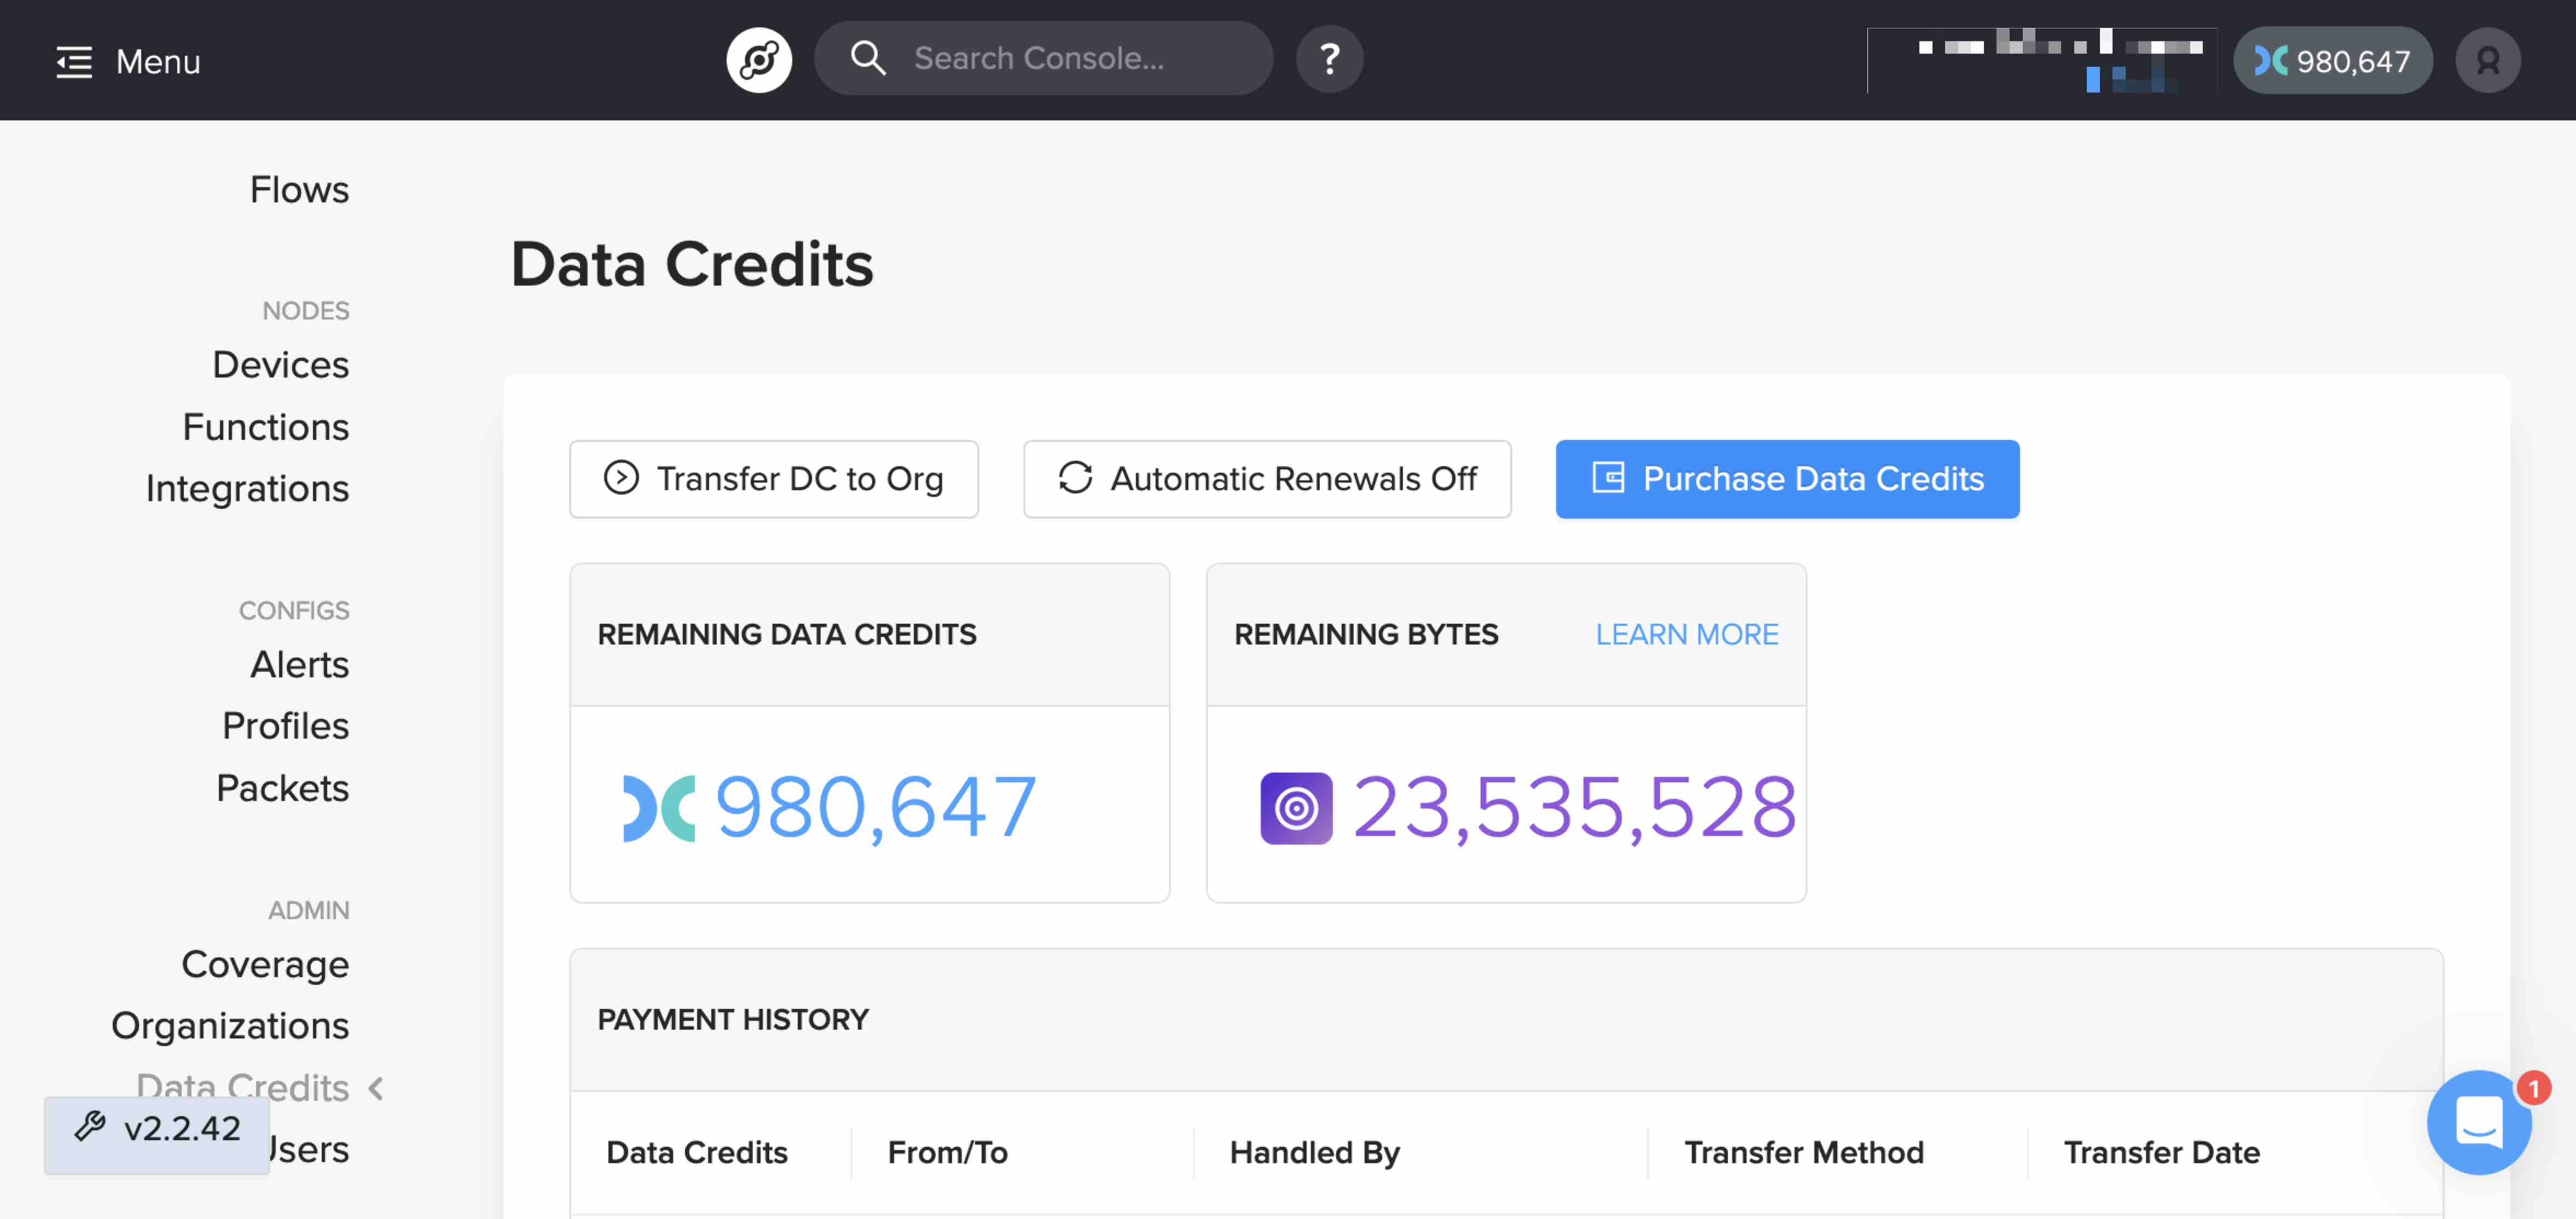
Visit the Helium Console and create an account.
-
Optional: The network offers some free credits for transmitting data over the Helium network. You might want to add more if your setup is permanent. The fees are very low, allowing a single sensor to operate for multiple years on a few bucks.
-
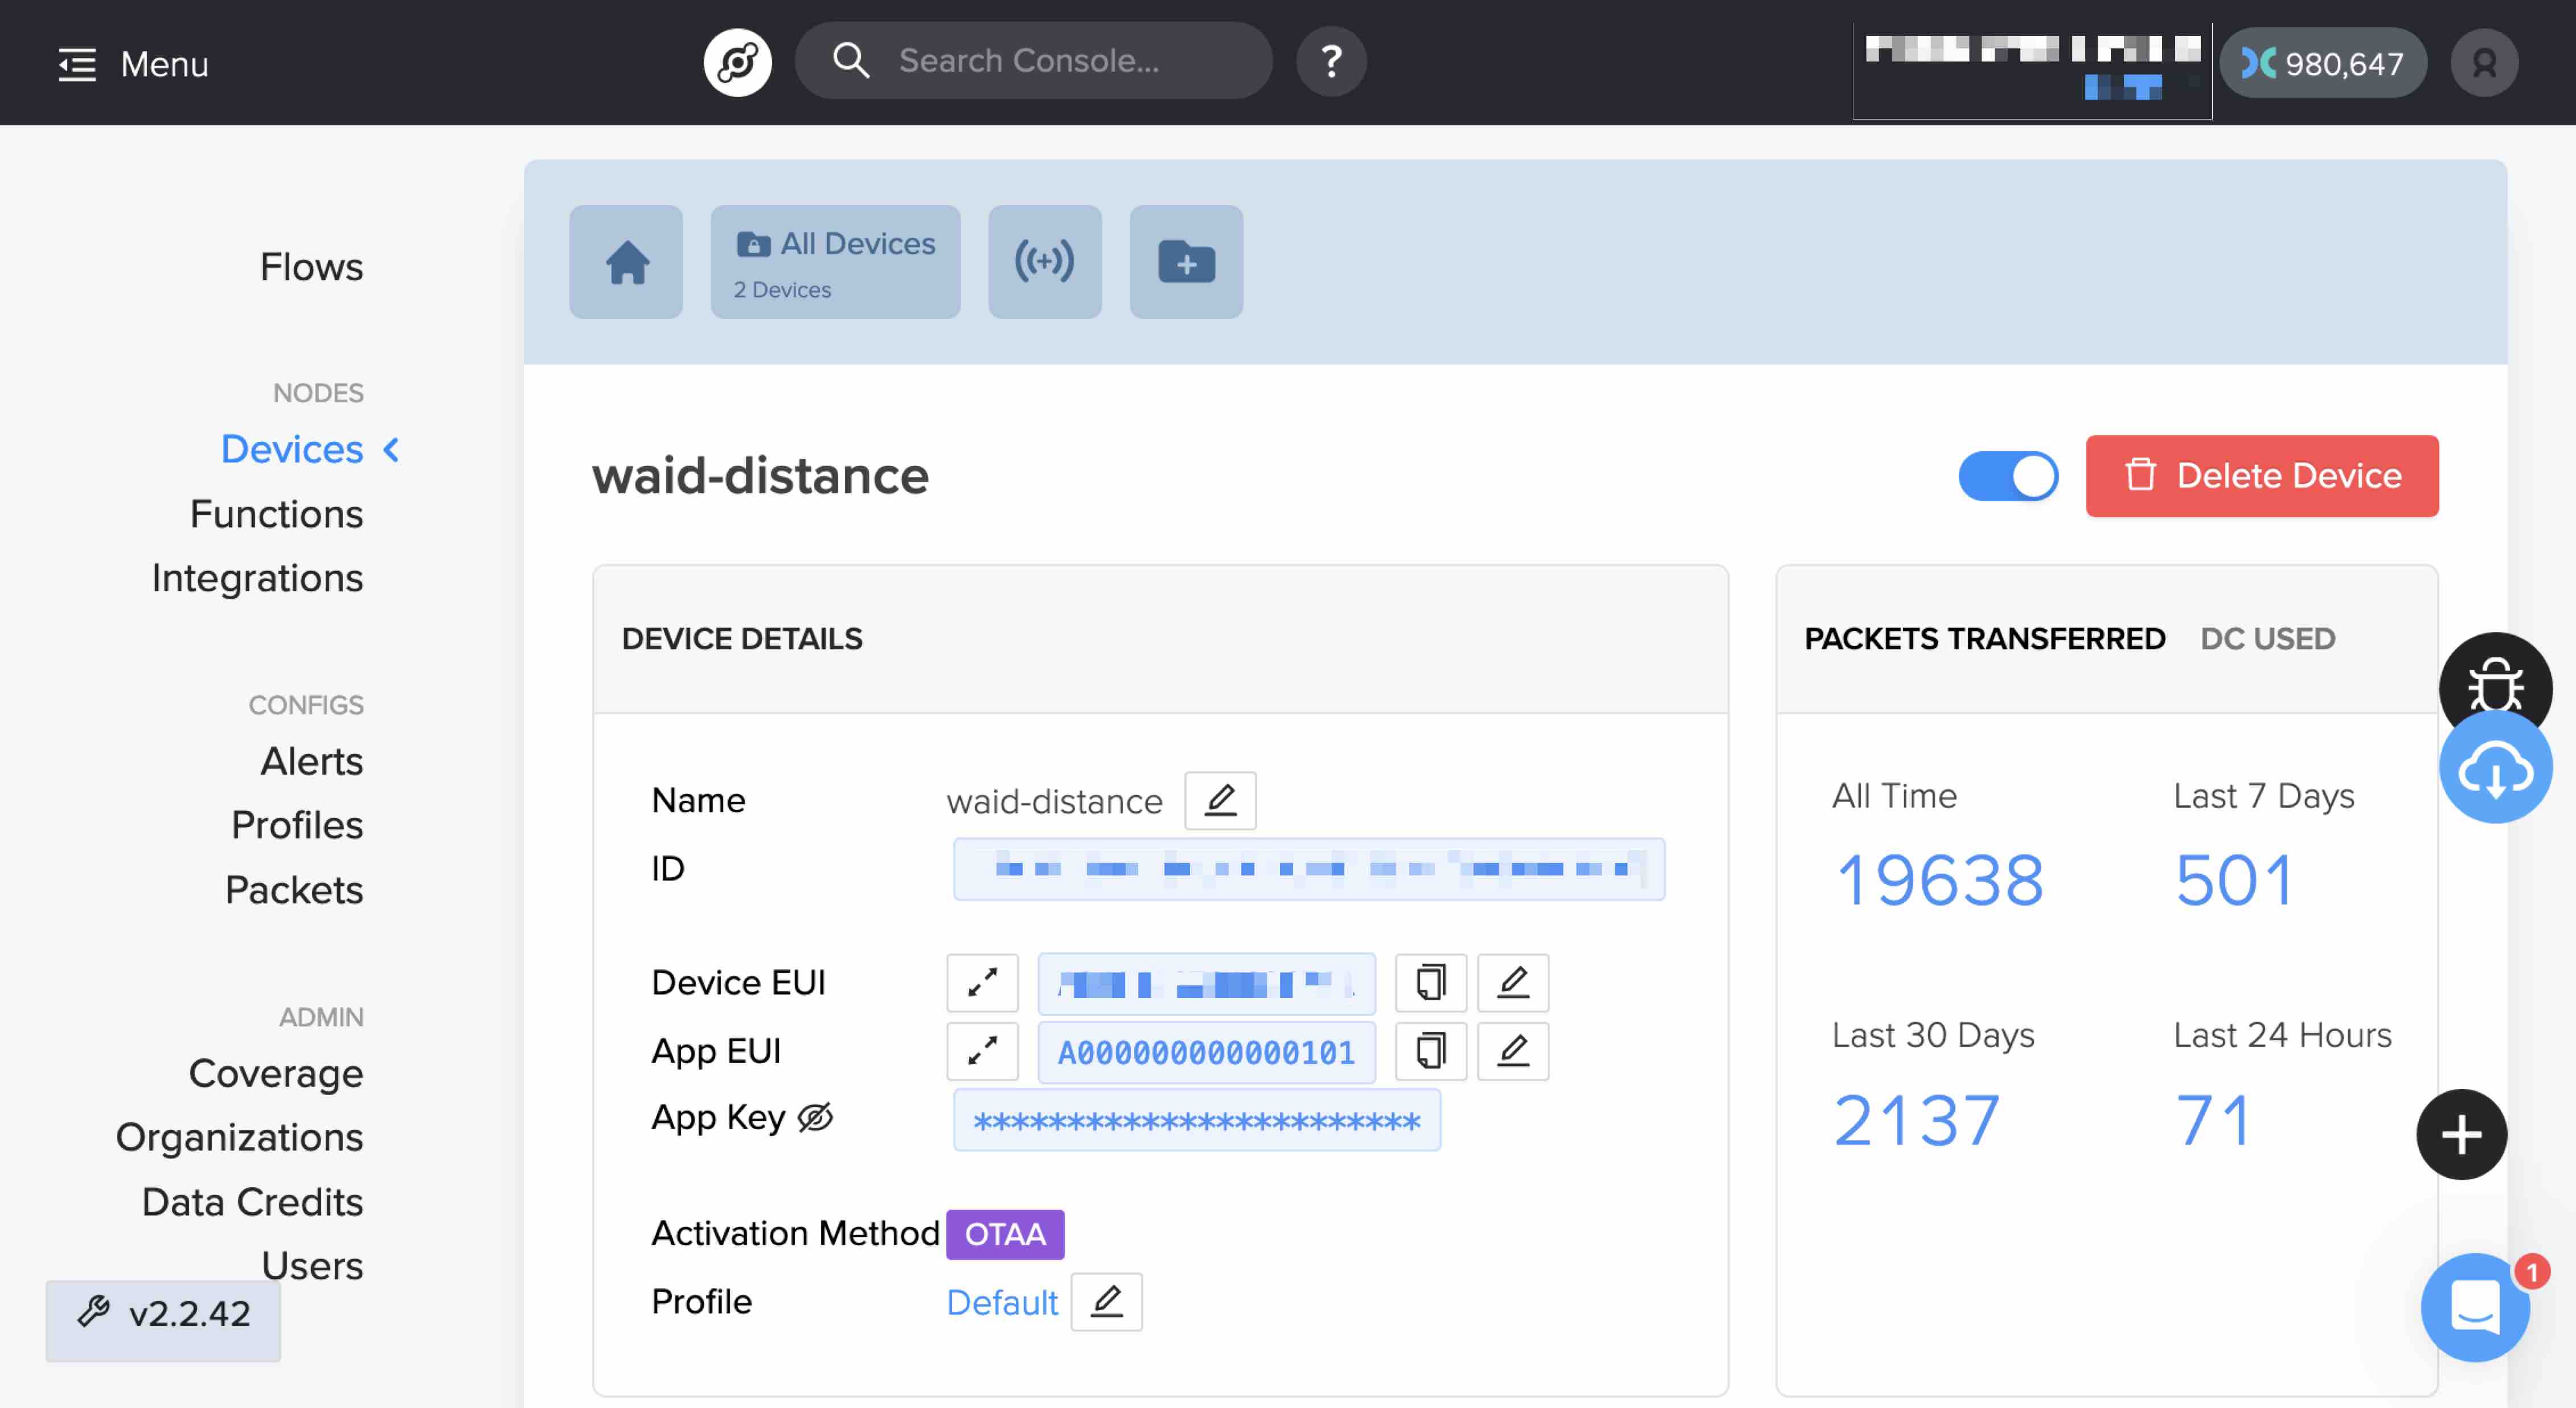
Onboard your sensor by providing the Device EUI, App EUI, and App Key, which should accompany your sensor.
-
Since the payload is encoded, you’ll need to create a decoding function and add code, which can be found in the sensor’s manual.
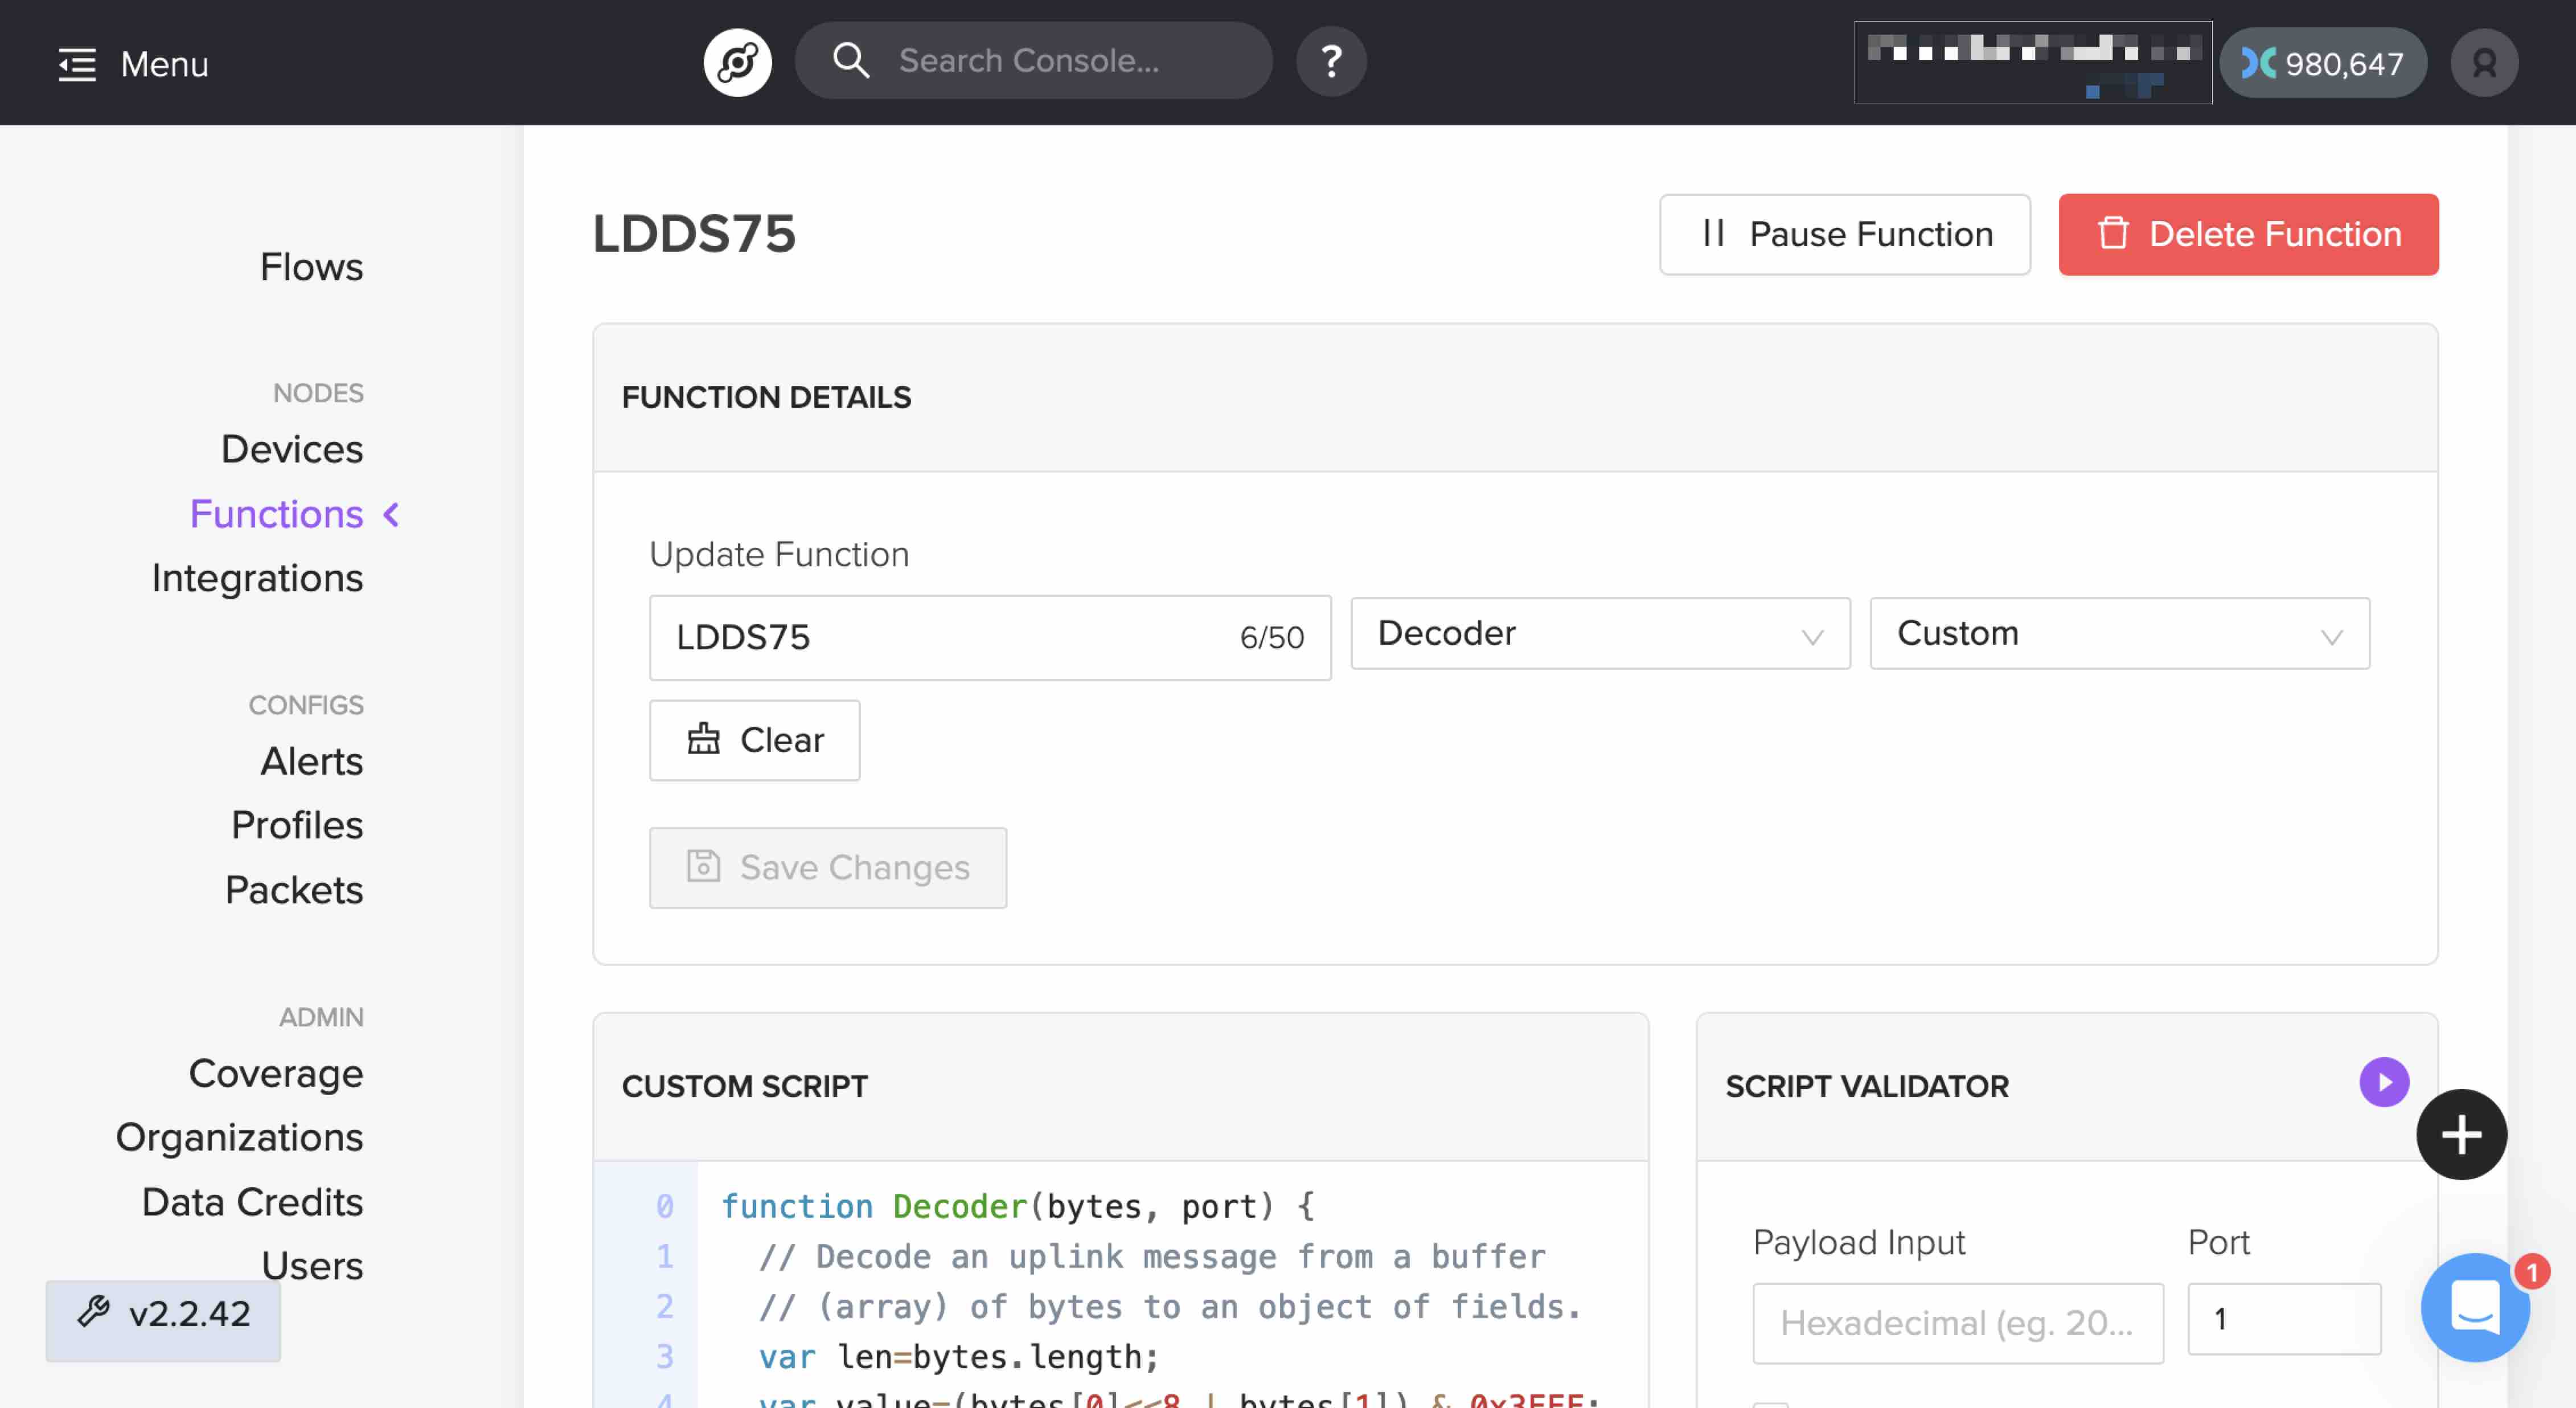
function Decoder(bytes, port) {
  // Decode an uplink message from a buffer
  // (array) of bytes to an object of fields.
  var len=bytes.length;
  var value=(bytes[0]<<8 | bytes[1]) & 0x3FFF;
  var batV=value/1000;//Battery,units:V

  var distance = 0;
  if(len==5)
  {
   value=bytes[2]<<8 | bytes[3];
   distance=(value);//distance,units:mm
   if(value<20)
    distance = "Invalid Reading";
  }
  else
   distance = "No Sensor";

  var interrupt = bytes[len-1];
  return {
       Bat:batV ,
       Distance:distance,
       Interrupt_status:interrupt
  };
}
-
Next, integrate with AWS. Helium has greatly simplified this process. Create a new IAM user in AWS with the “AWSIoTConfigAccess” permission policy, which is managed by AWS. Generate API access keys and supply them when adding AWS integration in the Helium console. All required AWS configurations, such as a new IoT Thing, certificates, etc., are then automatically completed.
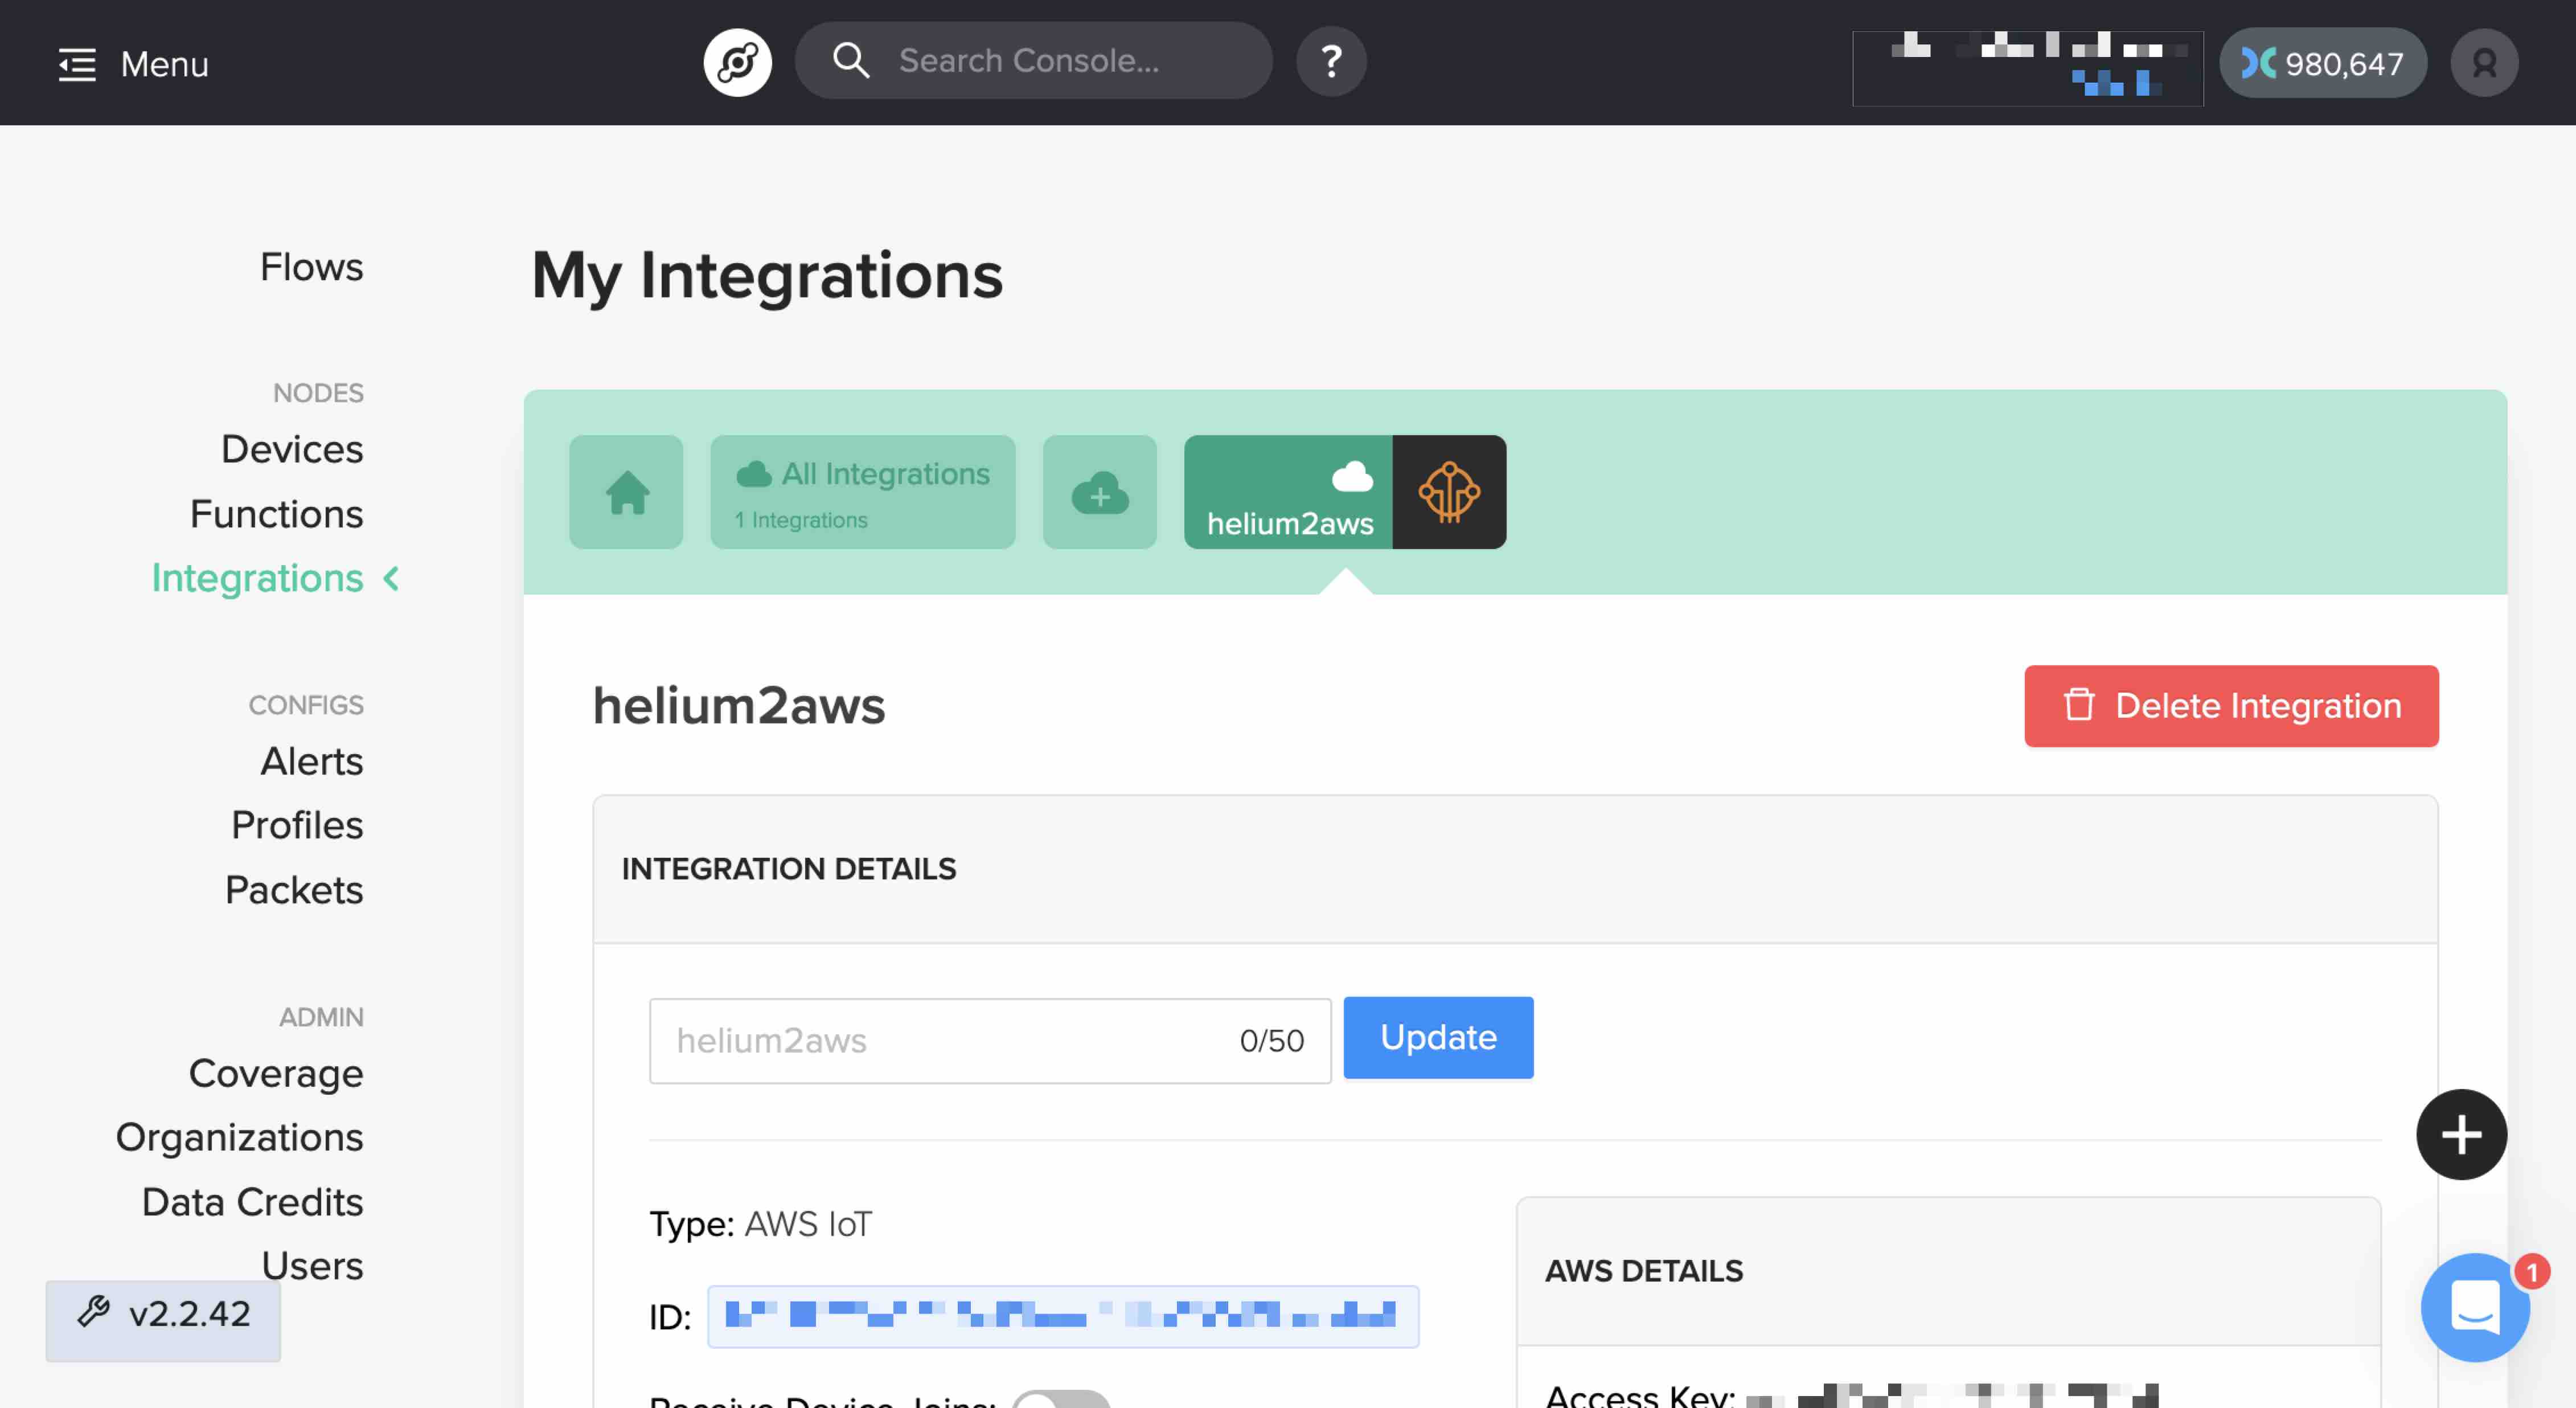
-
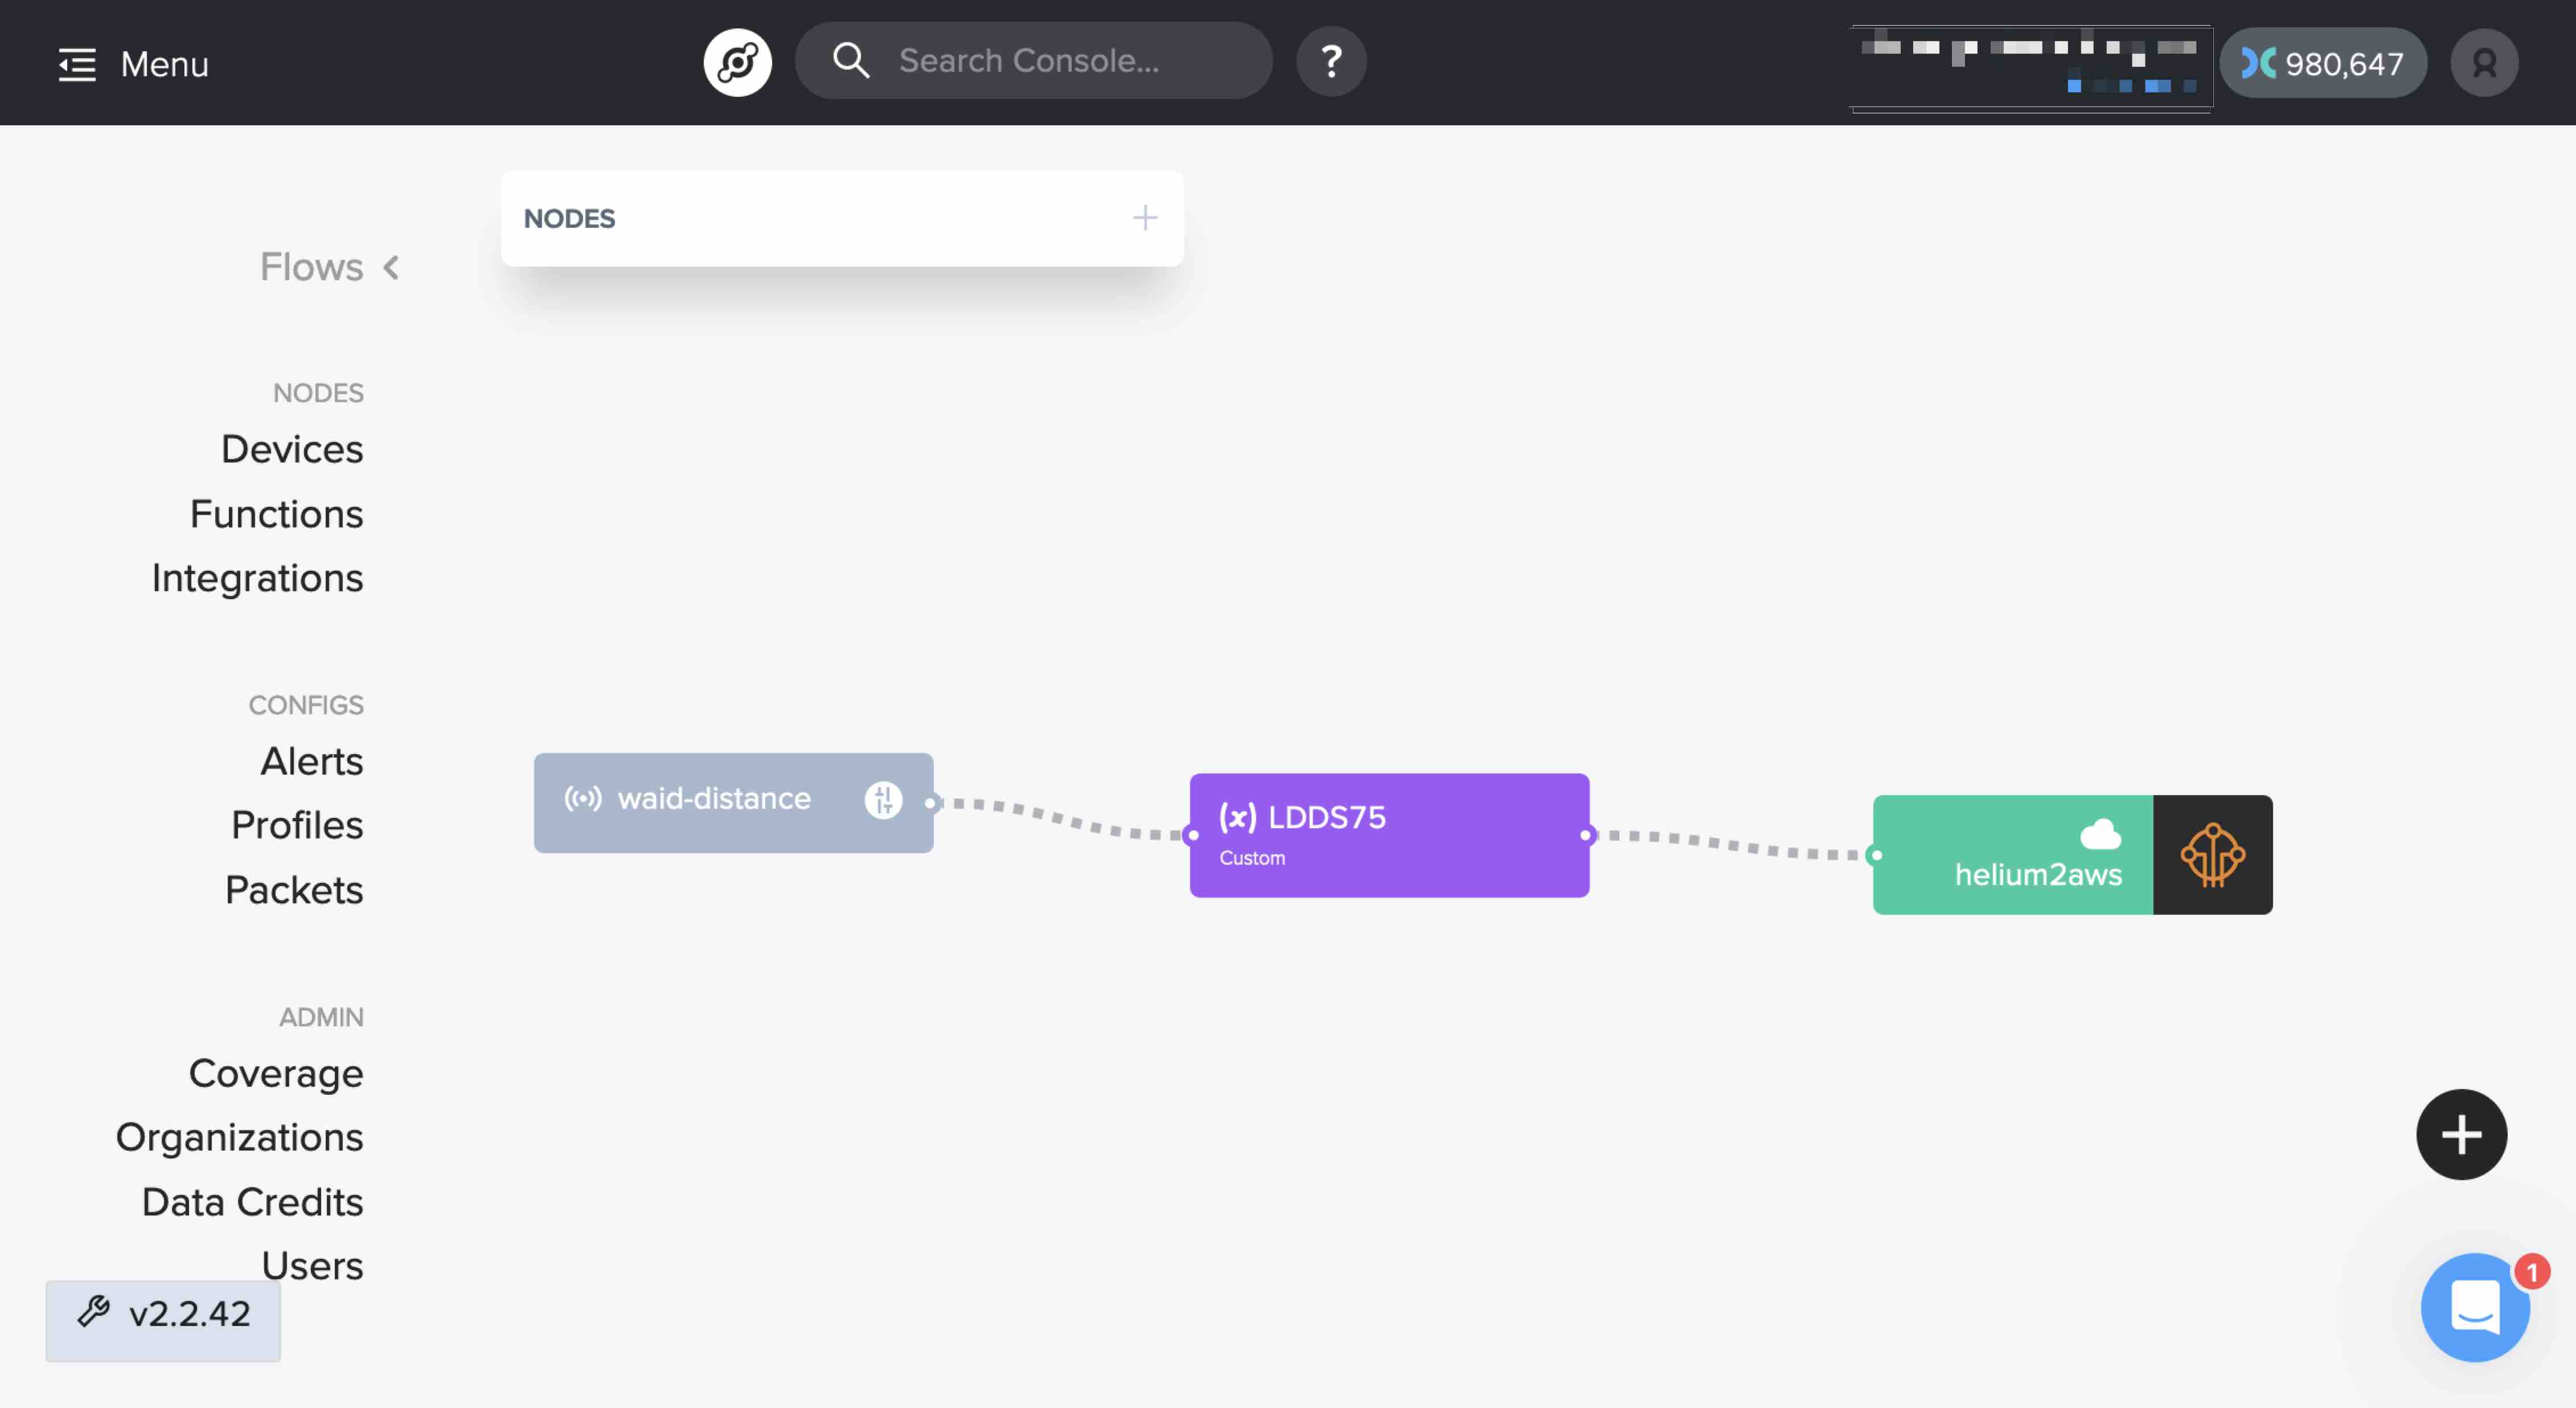
To finalize the configuration in the Helium console, create a flow that connects your device, the decoding function, and the AWS integration.
Dashboard (AWS)
Next up is creating a dashboard with the transmitted data in AWS. Follow the steps below:
-
Login to AWS Console.
-
Select the region you used to onboard the device above. I used eu-central-1, located in Frankfurt.
-
Navigate to the IoT Core service.
-
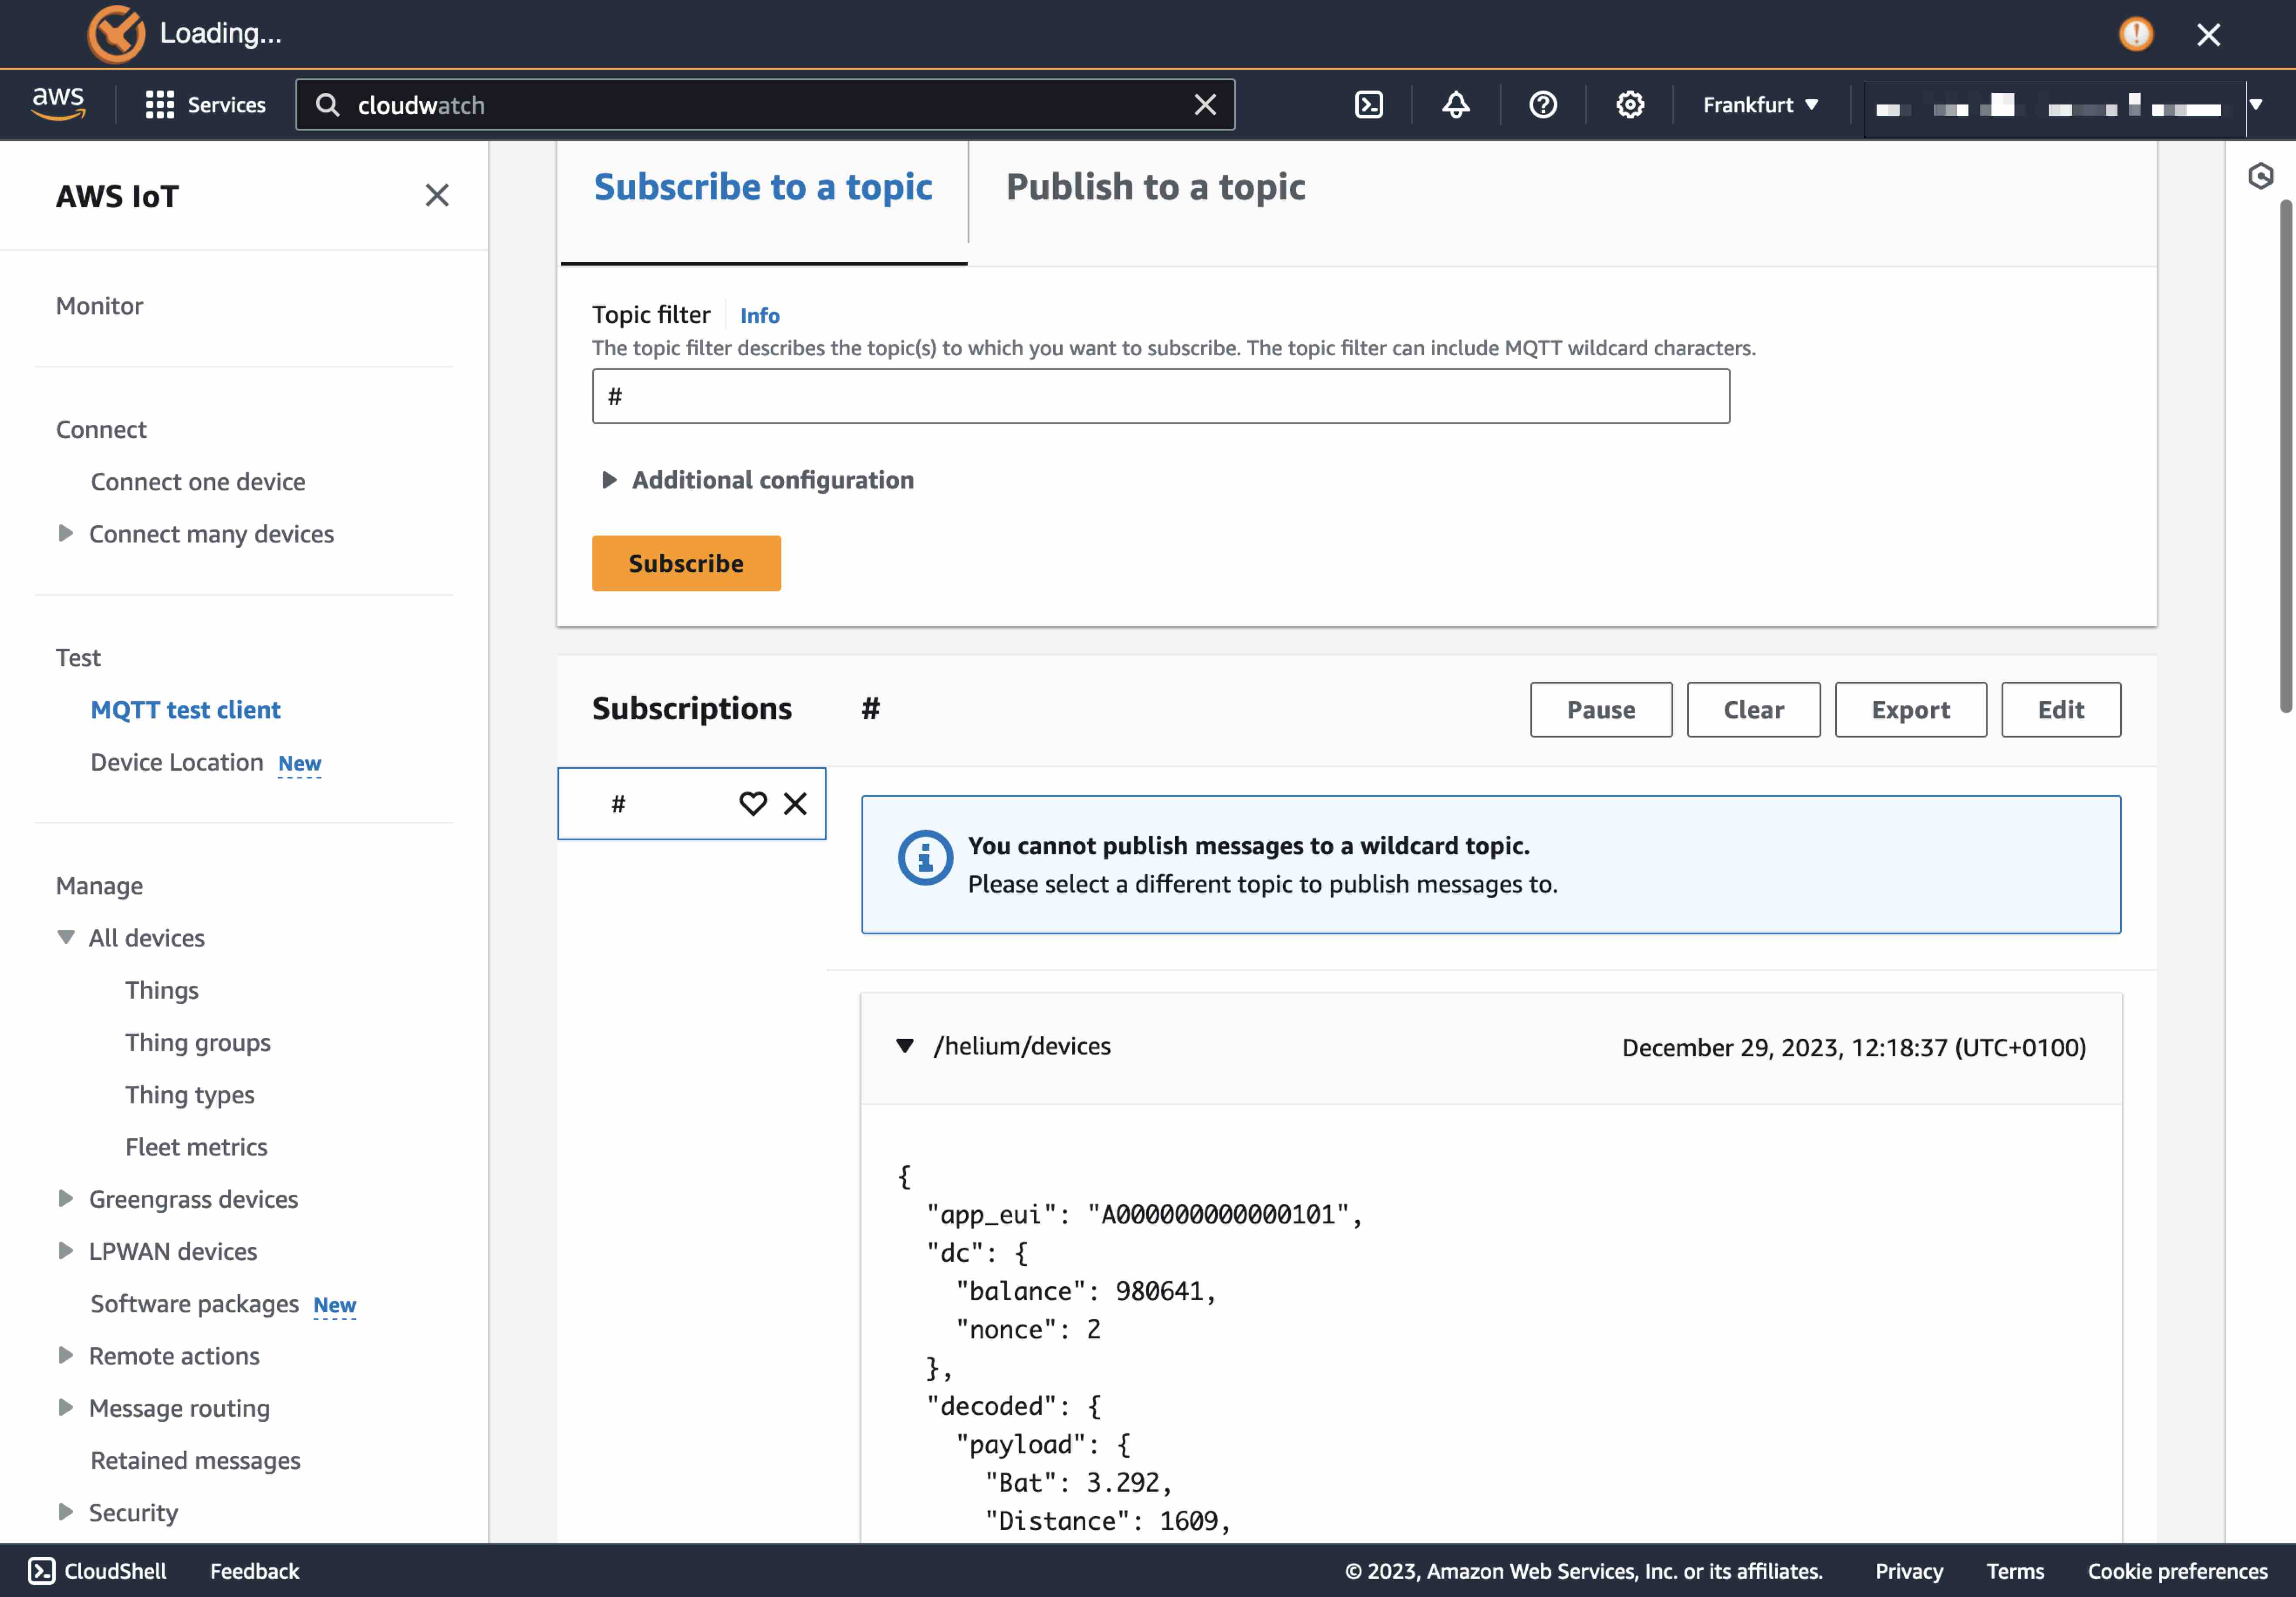
Optional: Test your integration by selecting “MQTT test client” in the Test section of the left-hand side menu. Subscribe to a topic by entering a ‘#’ (to display all messages received by the MQTT broker) and click the subscribe button. You will need to wait until a new message is transmitted by your sensor. The Dragino LDDS75, for example, has a default submission cadence of 20 minutes.
-
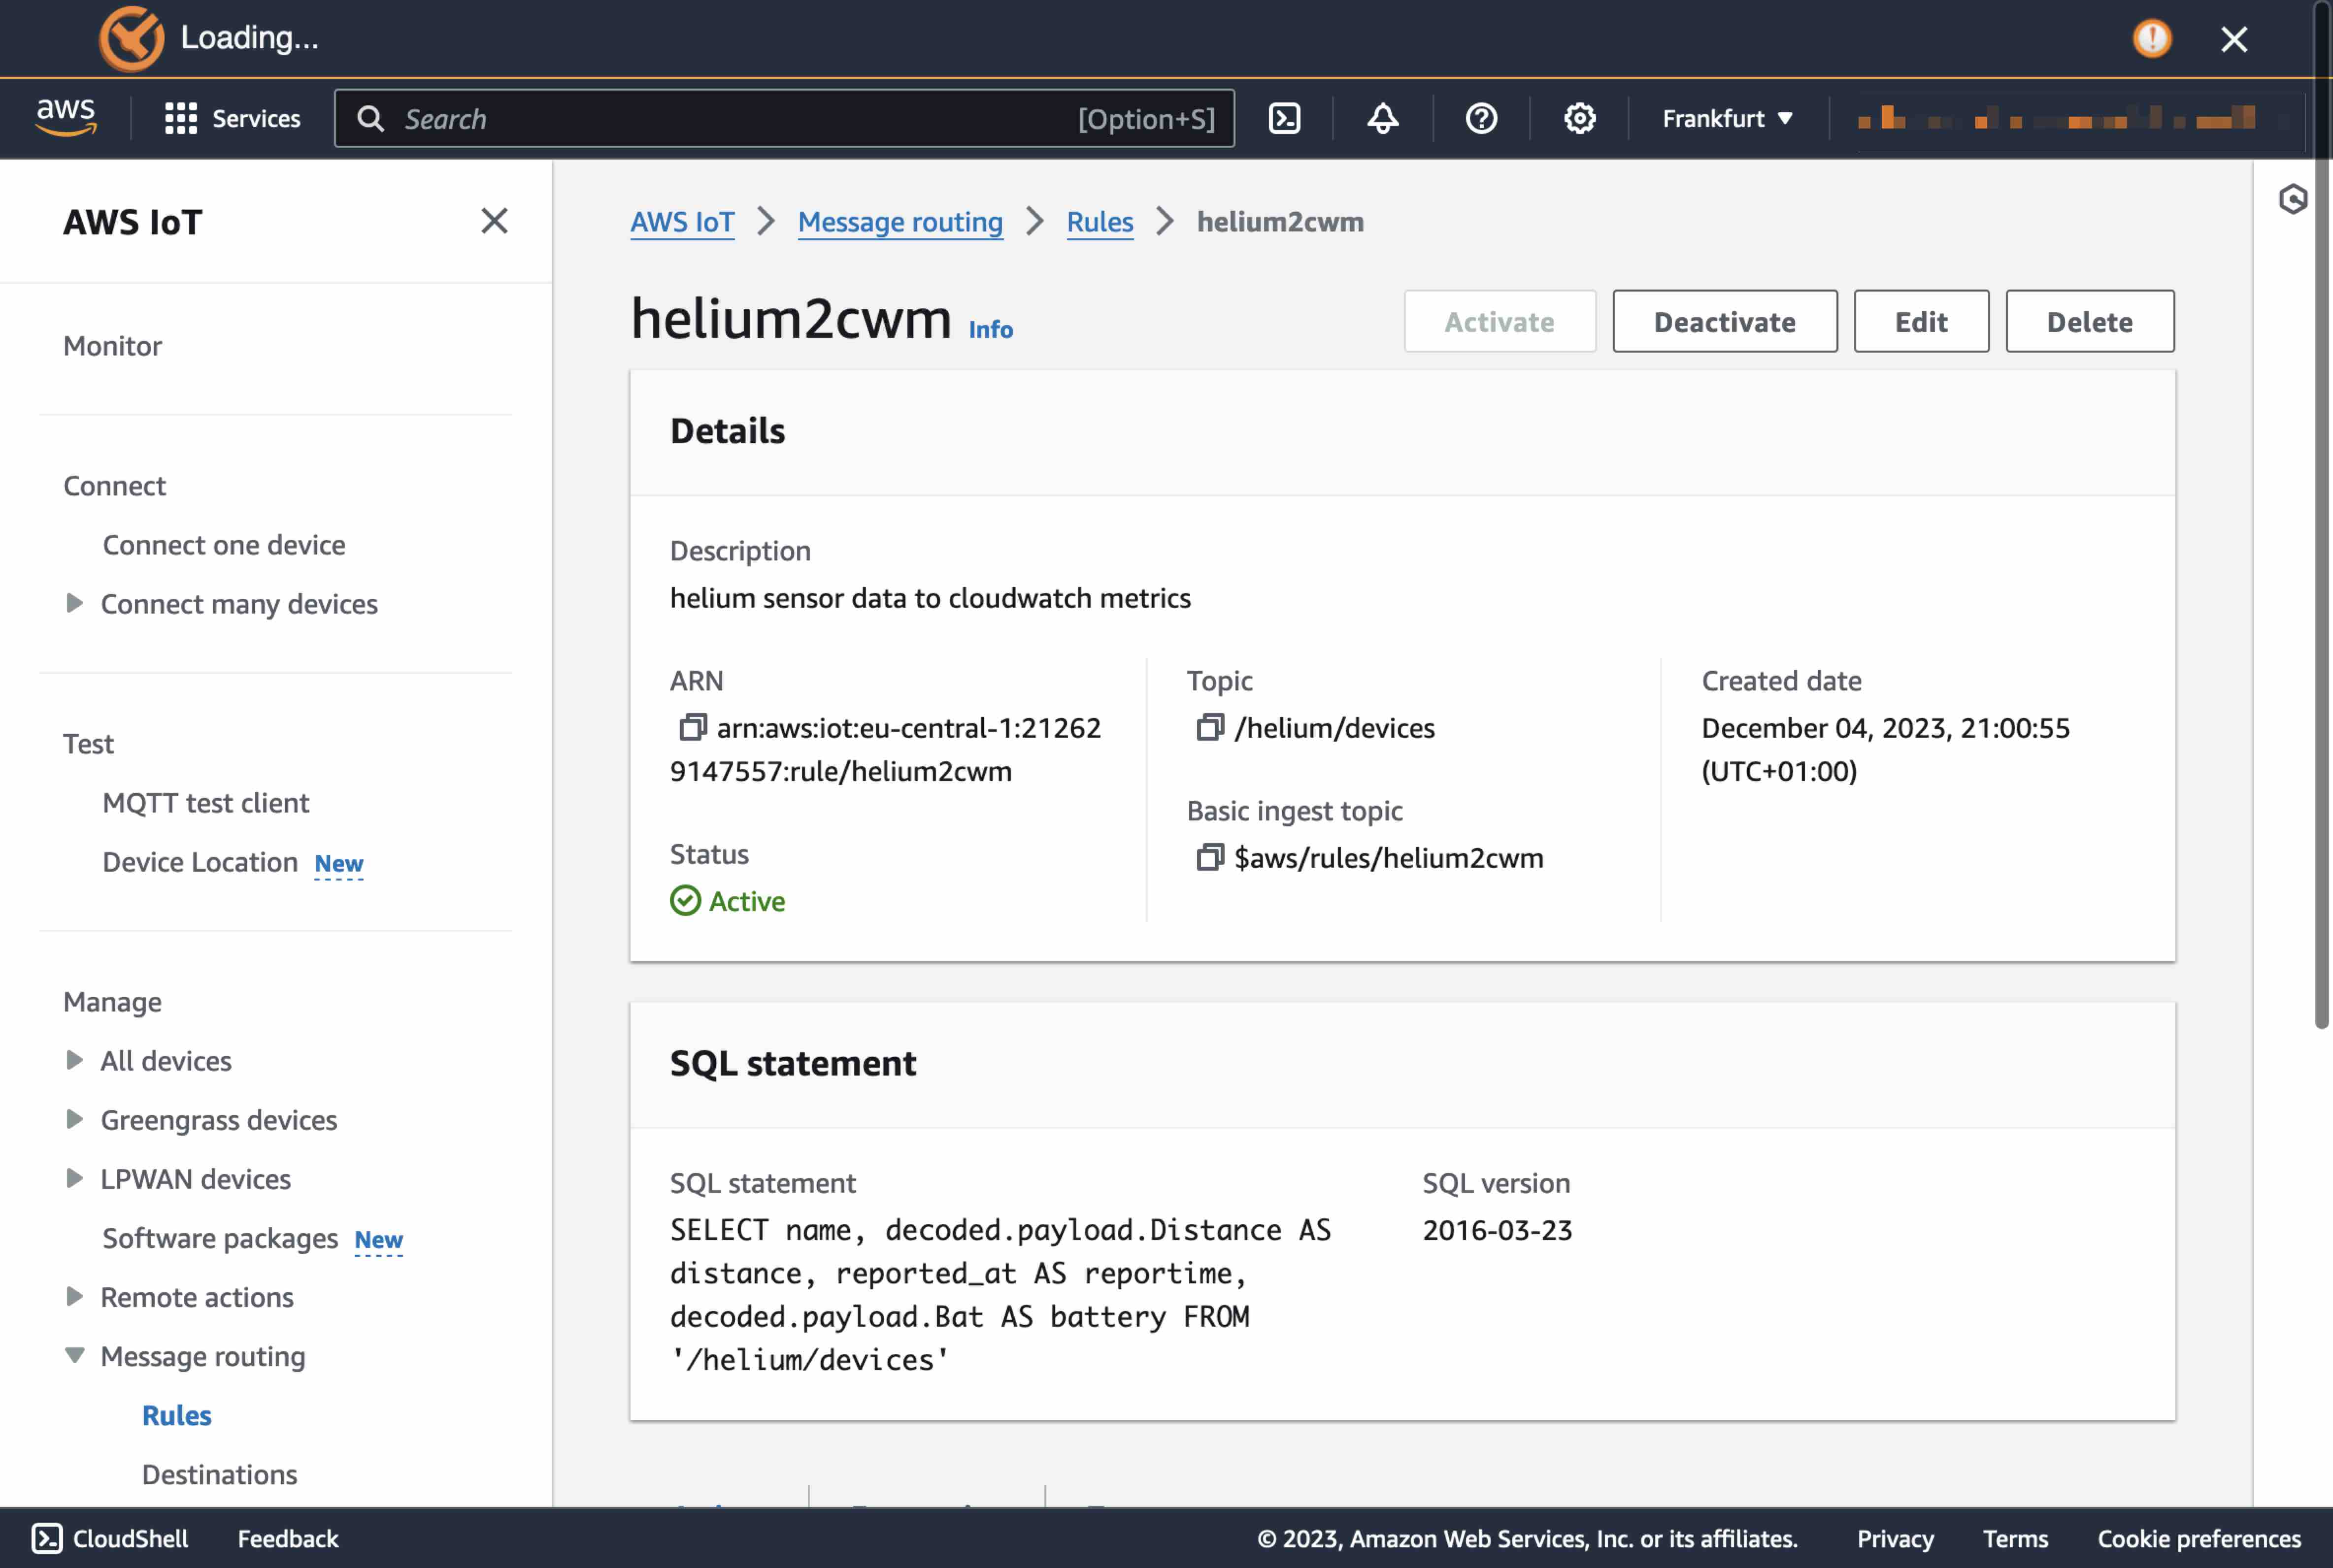
We will create a public dashboard using Amazon CloudWatch. To do this, go to “Message Routing/Rules” in the IoT Core Service to forward the data from IoT Core to Amazon CloudWatch. You need to add a new rule that is triggered when new data arrives. IoT Core uses SQL statements to filter the data. During the device onboarding mentioned above, you chose an MQTT Topic. Use the same one as the data source (FROM) in the SQL statement.:
SELECT name, decoded.payload.Distance AS distance, reported_at AS reportime, decoded.payload.Bat AS battery FROM '/helium/devices'
In the actions you will send the individual values to individual CloudWatch metrics. Create a new IAM role as proposed. Add the following actions:
-
Send message data to CloudWatch Metric (actual measurement)
- Metric name:
${name} - Metric namespace:
${topic()} - Value:
${decoded.payload.Distance}
- Metric name:
-
Send message data to CloudWatch Metric (actual mesurement minus mesurement without water in the basement)
- Metric name:
Wasserstand - Metric namespace:
${topic()} - Value:
${1608 - decoded.payload.Distance}
- Metric name:
-
Send message data to CloudWatch Metric (Battery voltage level)
- Metric name:
Batterie - Metric namespace:
${topic()} - Value:
${decoded.payload.Bat}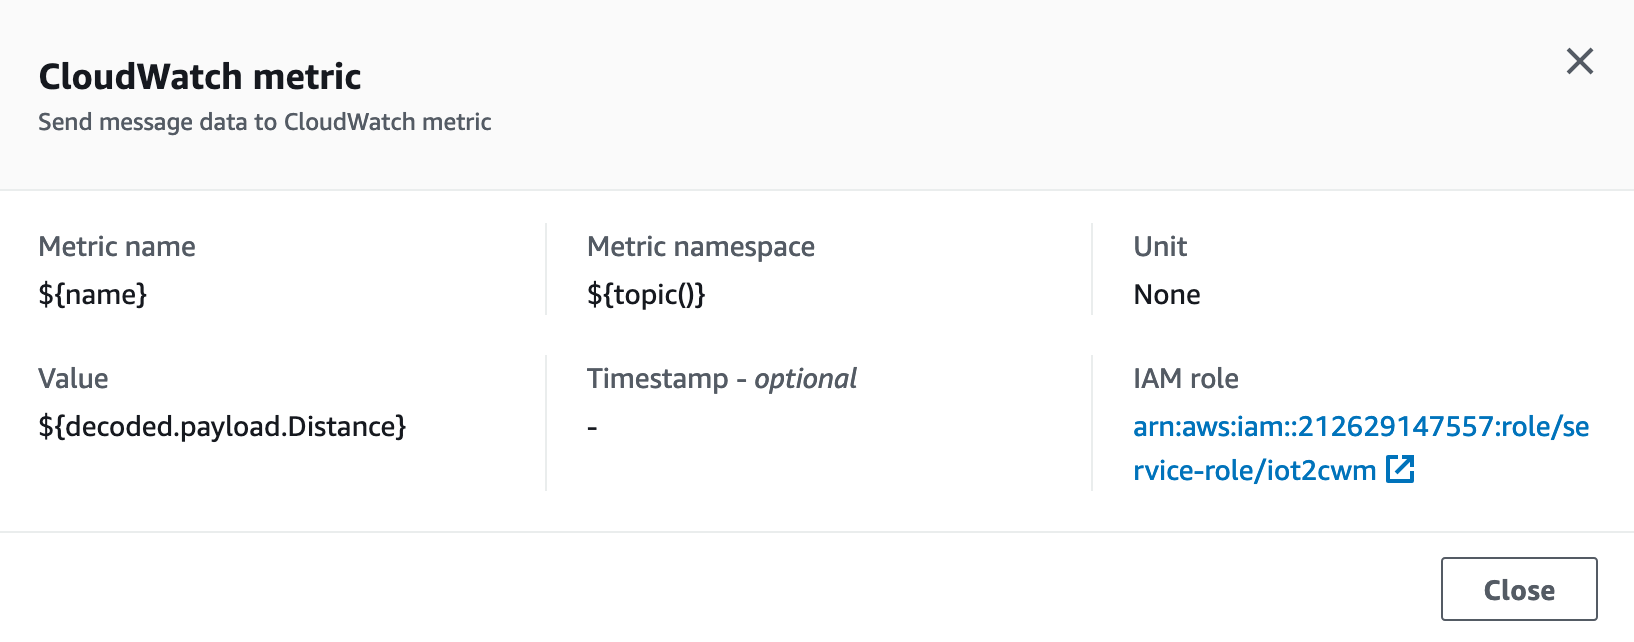
- Metric name:
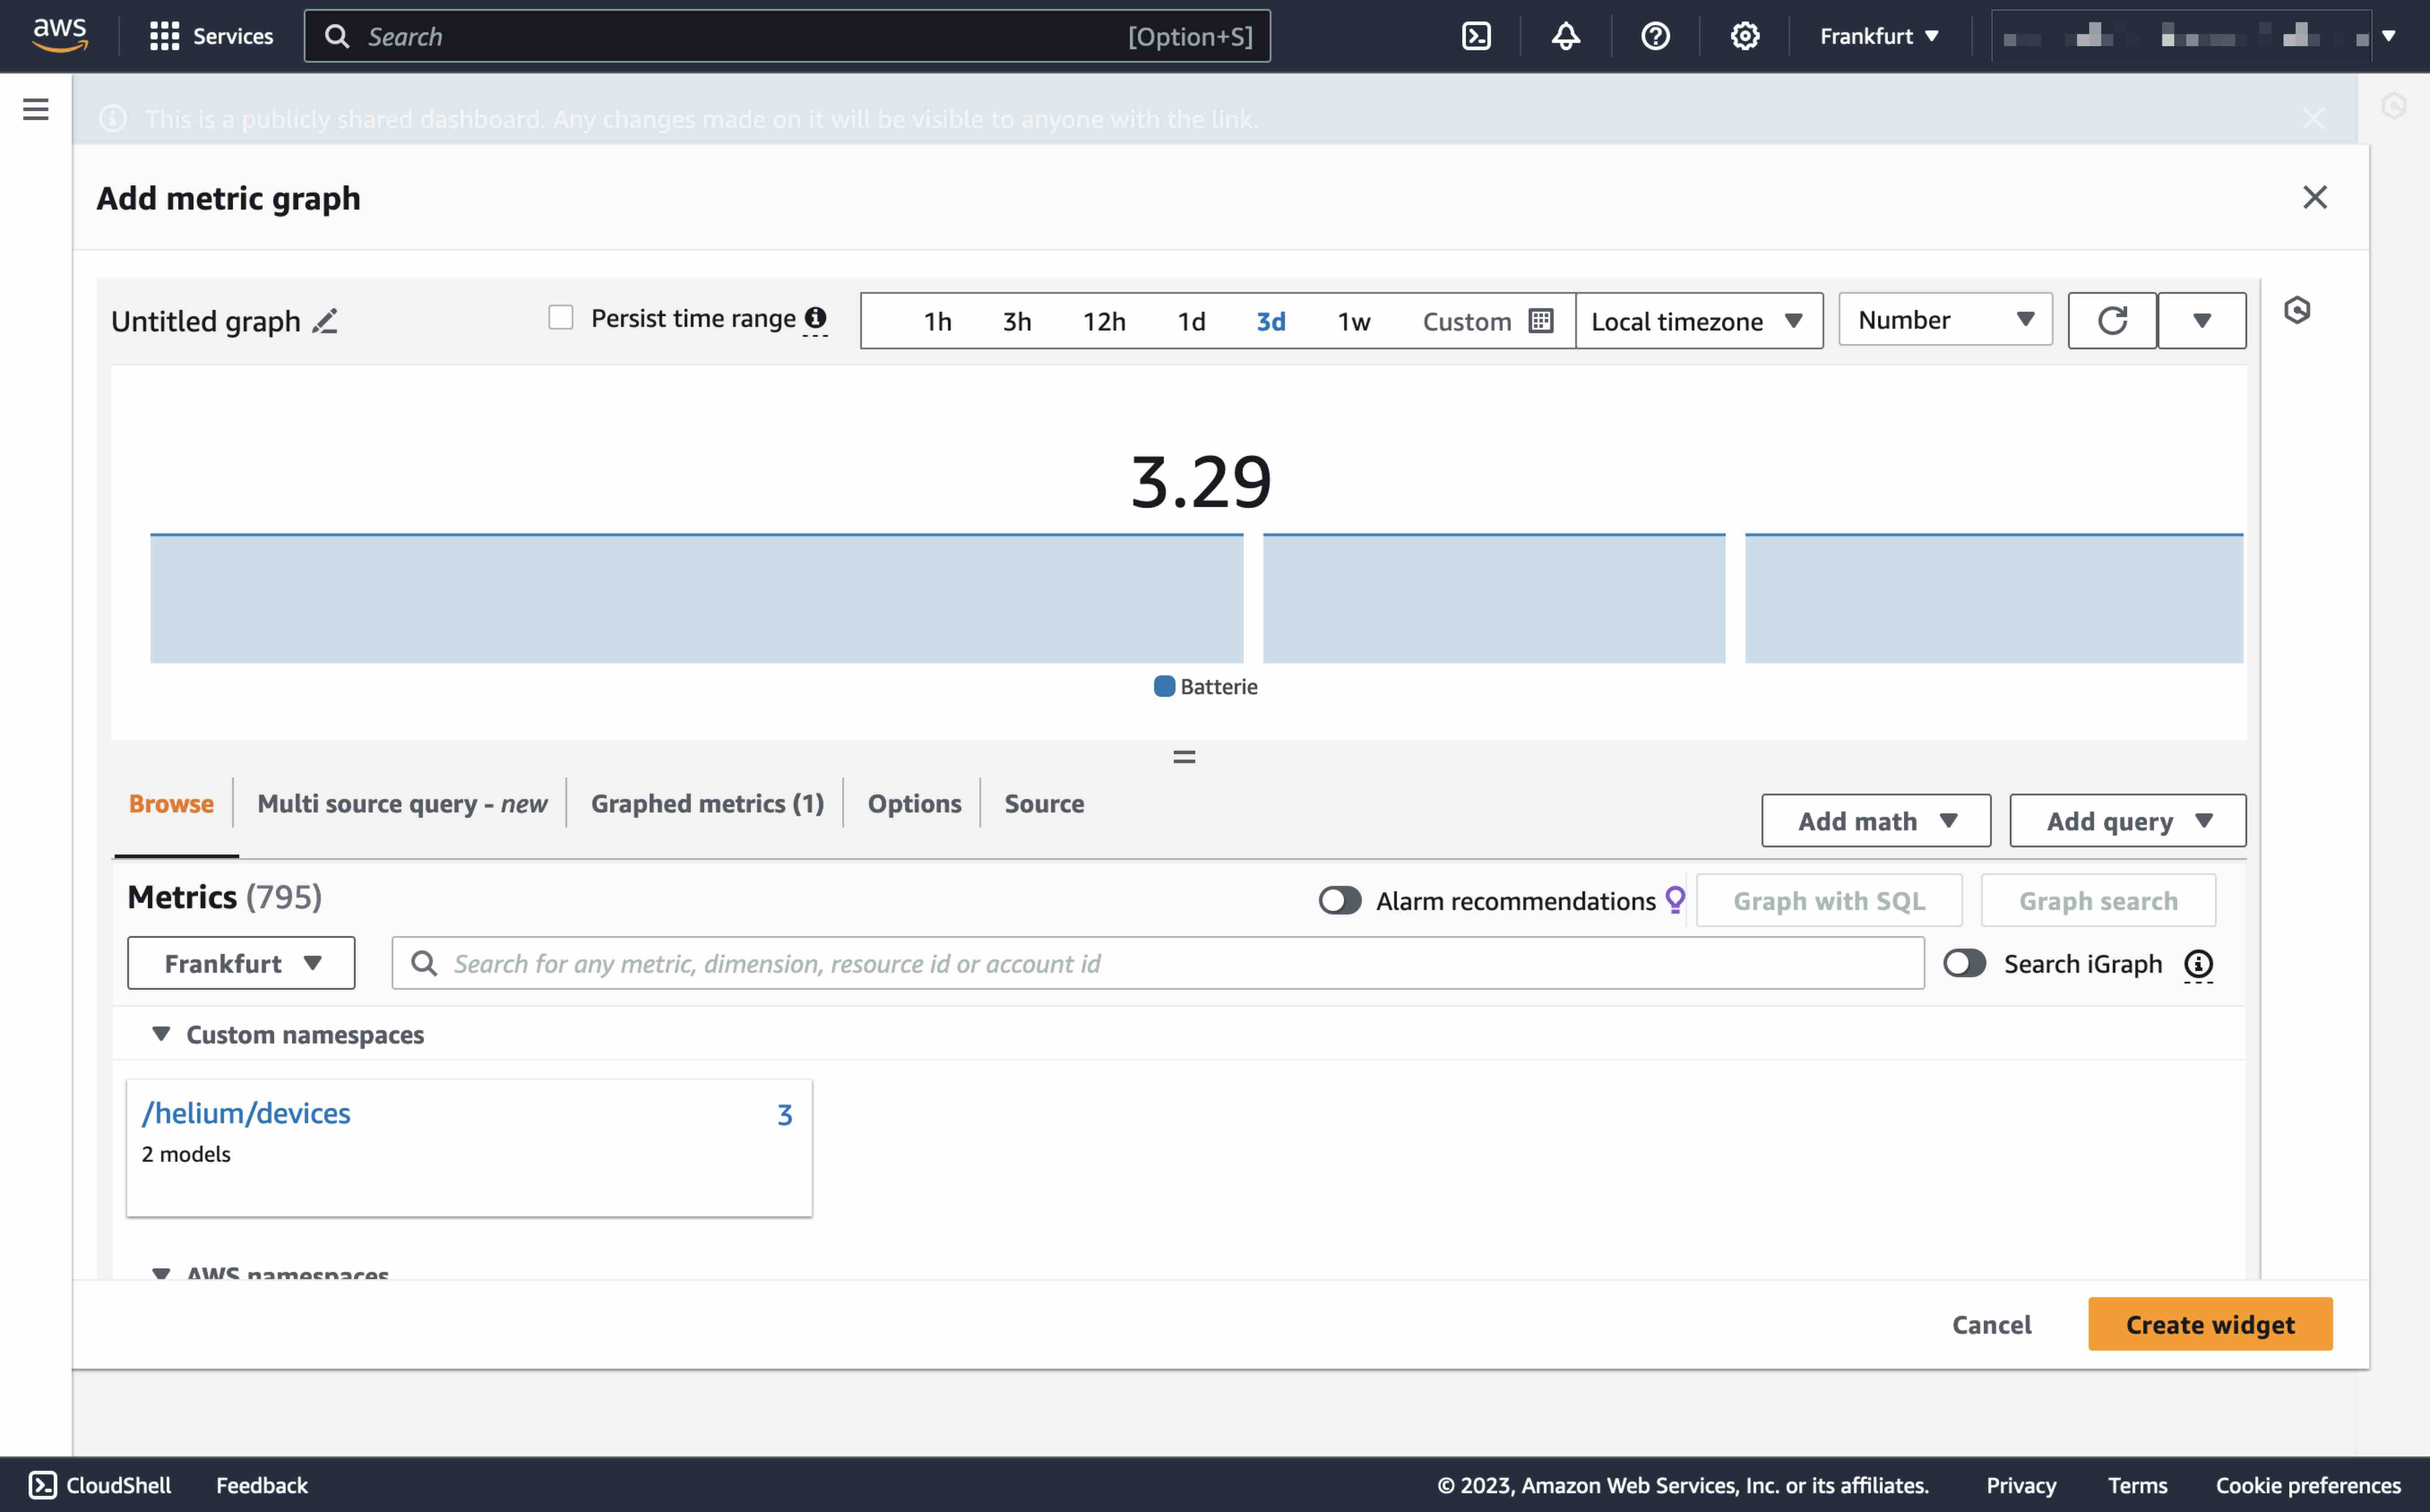
- As soon as the rules are executed for the first time (the relevant CloudWatch Metrics do not exist prior to this), you can proceed to the CloudWatch service to configure your Dashboard. Click on “Dashboards” in the left-hand menu. Add widgets by clicking the plus sign in the upper right corner. My dashboard looks like this:
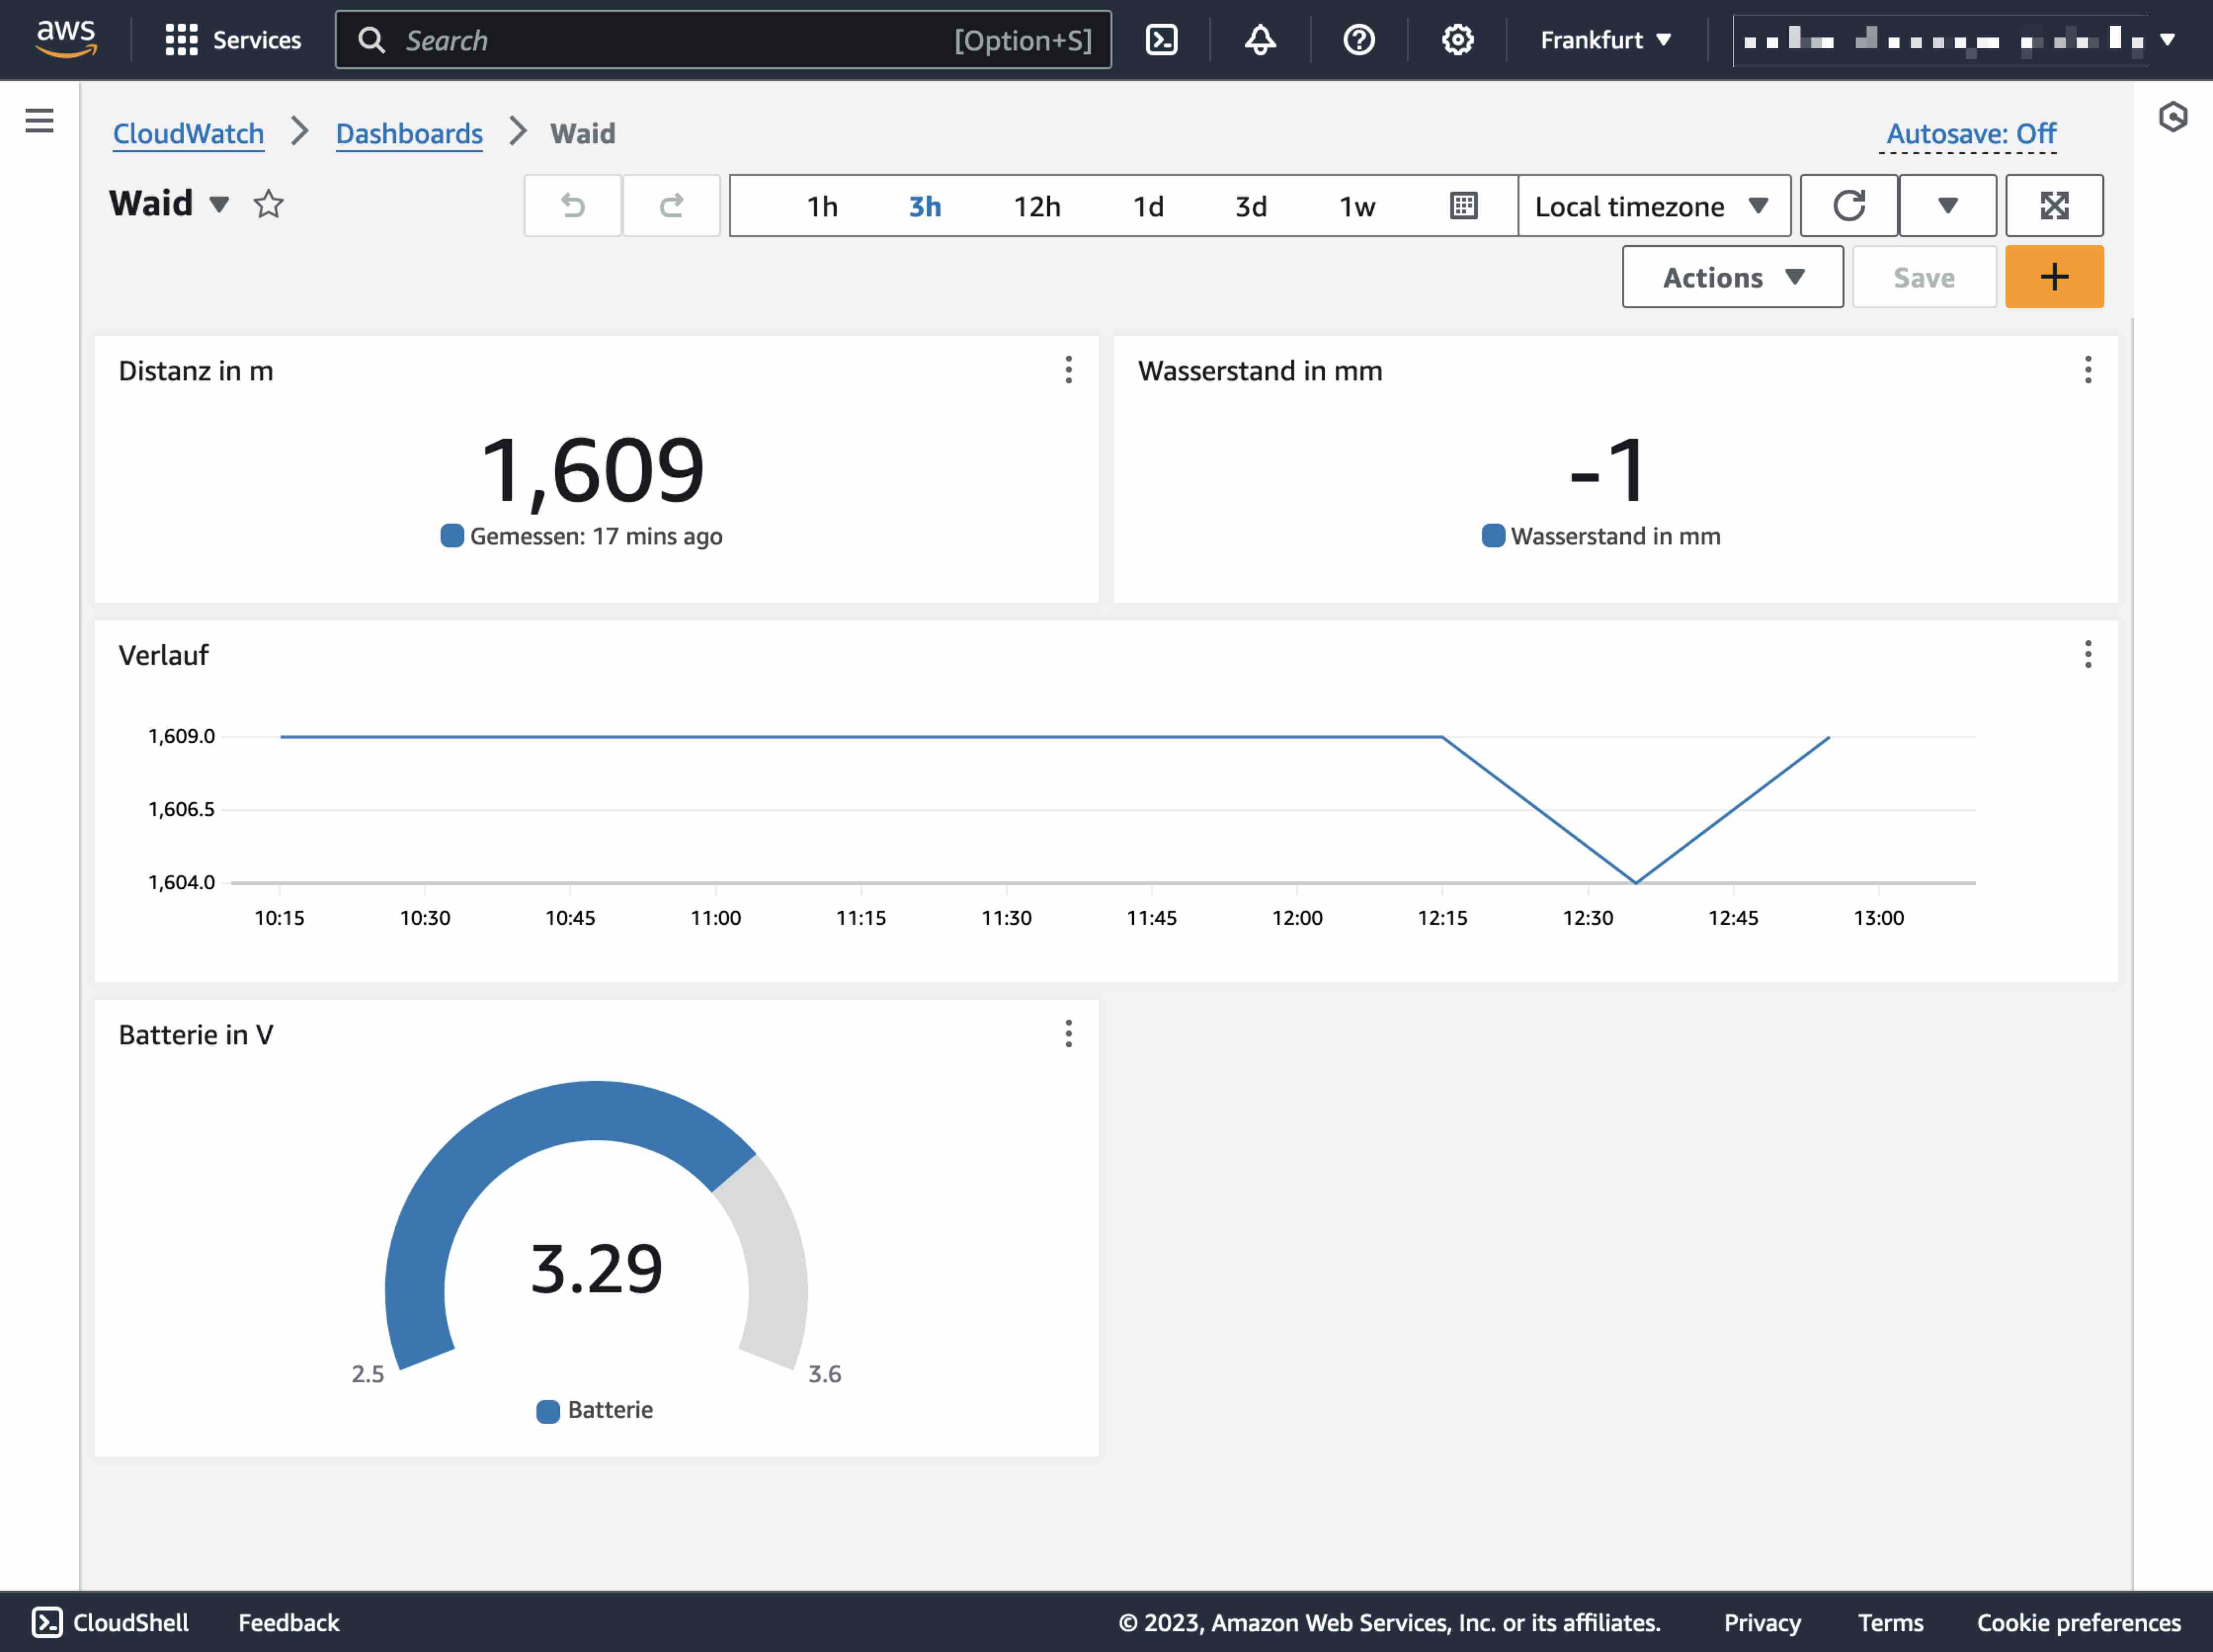
Add widgets and access the desired metrics in the custom namespace named after the MQTT Topic. You can edit the labels by clicking on the pen icon next to them.
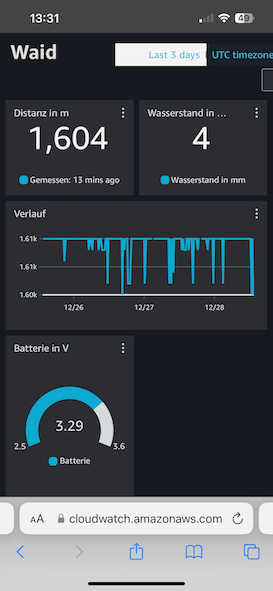
To view the dashboard on my mobile phone, I needed to enlarge the widgets to render optimally on an iPhone.
-
Save the new CloudWatch dashboard and make it publicly available. You can do this on the dashboard overview page by selecting it and clicking on “share dashboard.” When you share it publicly, everyone with the link can access it, like mine here.
-
Optional: Add a CloudWatch alert and set up SNS to send a text message to your phone.
With this, my father no longer needs to drive 45 minutes just to check if there’s water in the basement. I added the link from above to the home screen of his iPhone so he has a convenient app-like access to the data.